2017’s Best Places to Be a Real-Estate Agent

“Location, location, location” might be the most hackneyed expression in the real-estate profession, but the principle applies just as much to realtors as it does to their clients. After all, success in the industry hinges on both an agent’s work ethic and area of operation.
Indeed, a career in real estate offers abundant perks. You can be your own boss, determine your own schedule, earn a potentially high income, and be ready to help your clients buy, rent or sell properties in just a few weeks or months, depending on your state’s licensing requirements. With time and experience, you could even build your own real-estate brokerage and hire your own agents.
But the job isn’t always a bowl of cherries, especially at the onset, as most established agents are inclined to admit. It requires real commitment, work outside normal business hours, a likeable personality and financial stability — in case of a tough season.
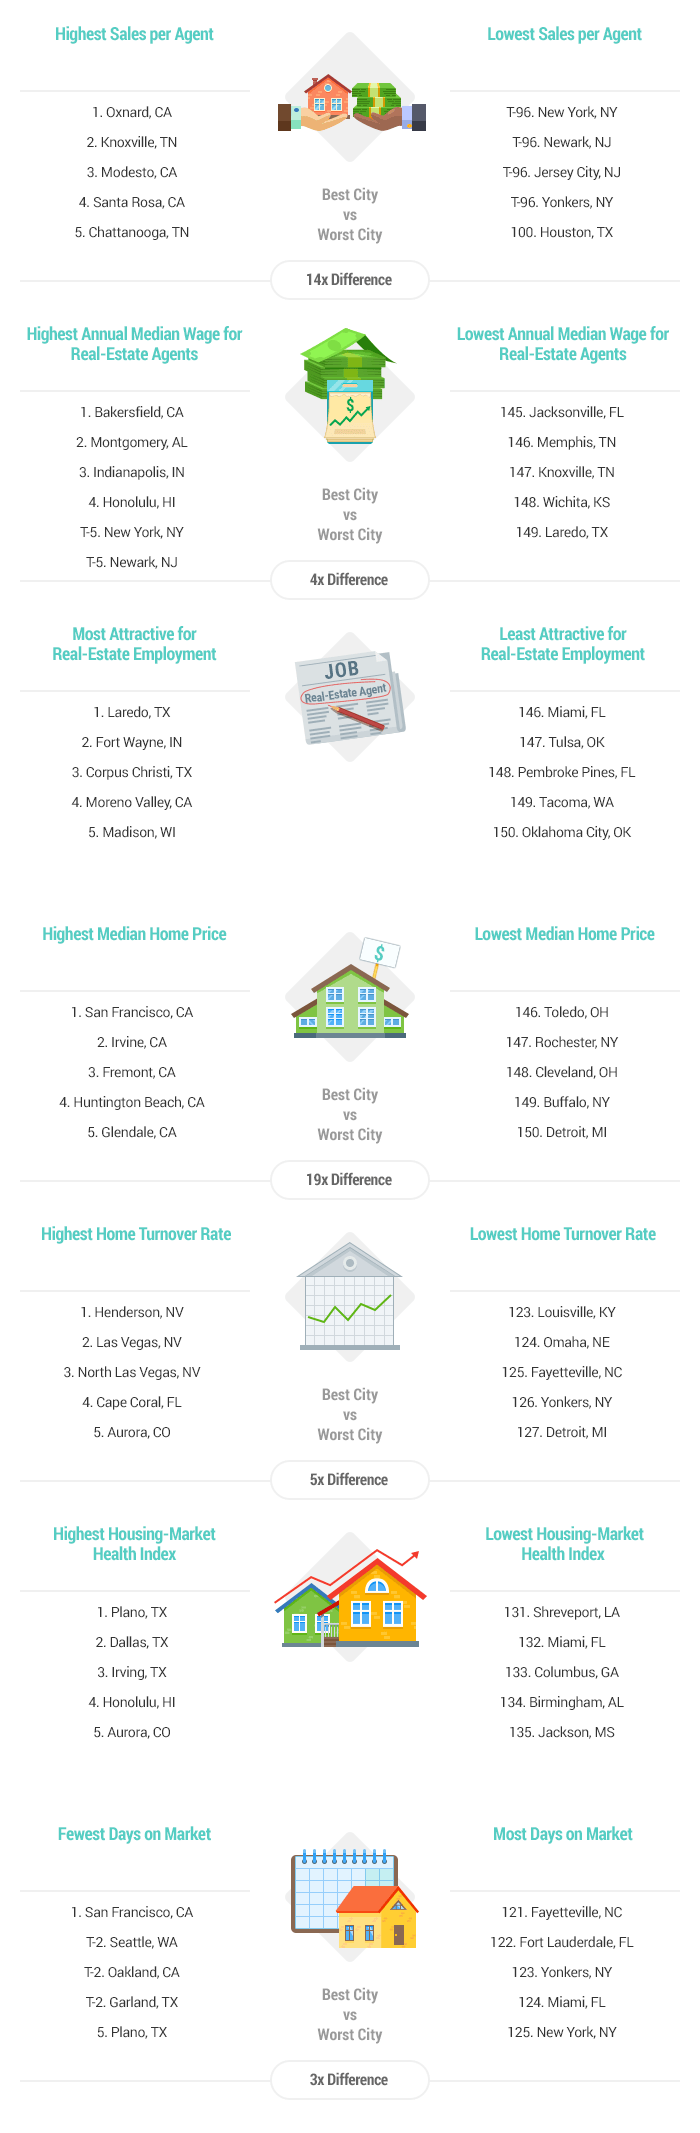
To determine the best markets for this particular profession, WalletHub’s analysts compared 150 of the largest U.S. cities across 14 key indicators of a healthy real-estate environment. Our data set ranges from “sales per agent” to “annual median wage for real-estate agents” to “housing-market health index.” Read on for our findings, advice and insight from experts, and a full description of our methodology.
The real-estate market is often unpredictable. For advice and insight on the current and future conditions shaping the industry, we turned to a panel of experts for their thoughts on the following key questions:
- Should real-estate agents feel threatened by new apps and other online tools offering services to potential homebuyers?
- How can real-estate agents protect themselves from the “boom-bust” cycle of the housing market?
- What tips do you have for a young real-estate agent? What does he or she need to do in order to get ahead in the current marketplace?
- In evaluating the best cities for real estate agents, what are the top five indicators?
- How likely is it that the Federal Reserve would increase interest rates again in the coming months? How would that impact real-estate agents?
In order to determine the best cities for real-estate agents, WalletHub’s analysts compared 150 of the most populated U.S. cities across two key dimensions, including “Job Opportunity & Competition” and “Real-Estate Market Health.” Our sample considers only city proper in each case and excludes cities in the surrounding metro area.
We evaluated the two dimensions using 14 relevant metrics, which are listed below with their corresponding weights. Each metric was graded on a 100-point scale, with 100 representing the most favorable conditions for real-estate agents. Data for the metrics marked with an asterisk (*) were available at the state level only.
We then calculated the overall score for each city based on its weighted average across all metrics and used the resulting scores to rank the cities accordingly.
Overall Rank | City | Total Score | ‘Job Opportunity & Competition’ Rank | ‘Real-Estate Market Health’ Rank |
|---|---|---|---|---|
| 1 | Honolulu, HI | 60.76 | 1 | 47 |
| 2 | Seattle, WA | 60.57 | 5 | 2 |
| 3 | Denver, CO | 58.30 | 8 | 4 |
| 4 | Boston, MA | 55.20 | 4 | 23 |
| 5 | Aurora, CO | 54.04 | 12 | 12 |
| 6 | Madison, WI | 52.75 | 16 | 16 |
| 7 | Reno, NV | 52.70 | 14 | 27 |
| 8 | San Francisco, CA | 51.84 | 11 | 42 |
| 9 | Irvine, CA | 51.82 | 32 | 9 |
| 10 | Austin, TX | 51.78 | 10 | 38 |
| 11 | Colorado Springs, CO | 51.64 | 23 | 15 |
| 12 | Portland, OR | 51.43 | 22 | 18 |
| 13 | Henderson, NV | 50.82 | 50 | 8 |
| 14 | Lincoln, NE | 50.77 | 29 | 13 |
| 15 | Santa Rosa, CA | 50.46 | 6 | 73 |
| 16 | Spokane, WA | 50.44 | 7 | 70 |
| 17 | Nashville, TN | 49.76 | 88 | 3 |
| 18 | Vancouver, WA | 49.24 | 54 | 14 |
| 19 | Washington, DC | 48.89 | 37 | 26 |
| 20 | New York, NY | 48.21 | 2 | 119 |
| 21 | Bakersfield, CA | 47.85 | 13 | 79 |
| 22 | Grand Rapids, MI | 47.78 | 28 | 50 |
| 23 | Tacoma, WA | 47.73 | 52 | 28 |
| 24 | Las Vegas, NV | 47.60 | 53 | 35 |
| 25 | San Jose, CA | 47.42 | 21 | 66 |
| 26 | North Las Vegas, NV | 47.36 | 55 | 32 |
| 27 | Port St. Lucie, FL | 47.33 | 68 | 20 |
| 28 | Rancho Cucamonga, CA | 47.29 | 18 | 75 |
| 29 | Lexington-Fayette, KY | 47.16 | 40 | 43 |
| 30 | Glendale, CA | 46.91 | 48 | 45 |
| 31 | Plano, TX | 46.69 | 79 | 19 |
| 32 | Tampa, FL | 46.53 | 117 | 6 |
| 33 | Durham, NC | 46.50 | 64 | 39 |
| 34 | Gilbert, AZ | 46.09 | 112 | 10 |
| 35 | St. Petersburg, FL | 45.97 | 120 | 7 |
| 36 | Memphis, TN | 45.84 | 147 | 1 |
| 37 | Riverside, CA | 45.82 | 30 | 71 |
| 38 | Ontario, CA | 45.79 | 38 | 63 |
| 39 | San Diego, CA | 45.78 | 51 | 51 |
| 40 | Orlando, FL | 45.62 | 118 | 11 |
| 41 | Sioux Falls, SD | 45.61 | 24 | 91 |
| 42 | Irving, TX | 45.29 | 81 | 24 |
| 43 | Atlanta, GA | 45.14 | 140 | 5 |
| 44 | Fremont, CA | 45.11 | 27 | 90 |
| 45 | Amarillo, TX | 44.99 | 19 | 112 |
| 46 | Dallas, TX | 44.75 | 92 | 30 |
| 47 | Boise, ID | 44.69 | 73 | 31 |
| 48 | Chandler, AZ | 44.67 | 116 | 22 |
| 49 | Grand Prairie, TX | 44.65 | 90 | 33 |
| 50 | Tempe, AZ | 44.51 | 110 | 25 |
| 51 | Los Angeles, CA | 44.38 | 77 | 49 |
| 52 | Huntington Beach, CA | 44.37 | 46 | 77 |
| 53 | Oakland, CA | 44.33 | 63 | 58 |
| 54 | Virginia Beach, VA | 44.29 | 41 | 86 |
| 55 | Peoria, AZ | 44.20 | 122 | 21 |
| 56 | Huntsville, AL | 43.90 | 66 | 60 |
| 57 | Mesa, AZ | 43.82 | 132 | 17 |
| 58 | Fontana, CA | 43.82 | 44 | 87 |
| 59 | Fort Worth, TX | 43.80 | 106 | 36 |
| 60 | Santa Clarita, CA | 43.58 | 95 | 48 |
| 61 | Stockton, CA | 43.58 | 67 | 65 |
| 62 | Rochester, NY | 43.54 | 26 | 106 |
| 63 | Salt Lake City, UT | 43.52 | 65 | 46 |
| 64 | Chattanooga, TN | 43.47 | 35 | 96 |
| 65 | Moreno Valley, CA | 43.40 | 33 | 93 |
| 66 | Worcester, MA | 43.34 | 15 | 116 |
| 67 | Raleigh, NC | 43.30 | 105 | 44 |
| 68 | Charlotte, NC | 43.23 | 74 | 53 |
| 69 | Oceanside, CA | 43.15 | 72 | 61 |
| 70 | Overland Park, KS | 43.15 | 61 | 72 |
| 71 | Chesapeake, VA | 43.10 | 59 | 80 |
| 72 | Tallahassee, FL | 43.01 | 42 | 94 |
| 73 | Anaheim, CA | 43.01 | 91 | 54 |
| 74 | Fort Wayne, IN | 42.92 | 25 | 145 |
| 75 | Oxnard, CA | 42.86 | 20 | 110 |
| 76 | Phoenix, AZ | 42.73 | 126 | 34 |
| 77 | Pembroke Pines, FL | 42.69 | 94 | 52 |
| 78 | Arlington, TX | 42.68 | 83 | 62 |
| 79 | Columbus, OH | 42.66 | 98 | 55 |
| 80 | Buffalo, NY | 42.65 | 17 | 127 |
| 81 | San Bernardino, CA | 42.58 | 69 | 76 |
| 82 | Yonkers, NY | 42.52 | 3 | 143 |
| 83 | Scottsdale, AZ | 42.50 | 78 | 68 |
| 84 | Pittsburgh, PA | 42.47 | 43 | 98 |
| 85 | Lubbock, TX | 42.44 | 57 | 59 |
| 86 | Jersey City, NJ | 42.18 | 31 | 107 |
| 87 | Sacramento, CA | 41.95 | 135 | 37 |
| 88 | Knoxville, TN | 41.79 | 49 | 102 |
| 89 | Glendale, AZ | 41.73 | 133 | 41 |
| 90 | Long Beach, CA | 41.64 | 102 | 67 |
| 91 | Corpus Christi, TX | 41.52 | 39 | 144 |
| 92 | Minneapolis, MN | 41.36 | 82 | 81 |
| 93 | Indianapolis, IN | 41.36 | 9 | 149 |
| 94 | Garden Grove, CA | 41.19 | 104 | 74 |
| 95 | El Paso, TX | 41.17 | 33 | 131 |
| 96 | Mobile, AL | 40.98 | 62 | 97 |
| 97 | Cape Coral, FL | 40.72 | 143 | 29 |
| 98 | Modesto, CA | 40.60 | 125 | 57 |
| 99 | Fresno, CA | 40.51 | 121 | 64 |
| 100 | Santa Ana, CA | 40.48 | 100 | 88 |
| 101 | Garland, TX | 40.46 | 108 | 78 |
| 102 | St. Paul, MN | 40.46 | 96 | 85 |
| 103 | St. Louis, MO | 40.18 | 112 | 83 |
| 104 | Norfolk, VA | 40.11 | 84 | 95 |
| 105 | Chula Vista, CA | 40.06 | 103 | 89 |
| 106 | Tulsa, OK | 40.04 | 36 | 118 |
| 107 | Birmingham, AL | 39.76 | 127 | 69 |
| 108 | Newport News, VA | 39.61 | 60 | 111 |
| 109 | Miami, FL | 39.43 | 97 | 92 |
| 110 | Albuquerque, NM | 39.26 | 99 | 82 |
| 111 | Hialeah, FL | 38.98 | 119 | 84 |
| 112 | Montgomery, AL | 38.96 | 45 | 133 |
| 113 | Laredo, TX | 38.67 | 93 | 101 |
| 114 | Jacksonville, FL | 38.22 | 145 | 56 |
| 115 | Augusta, GA | 38.17 | 58 | 122 |
| 116 | Winston-Salem, NC | 38.03 | 56 | 121 |
| 117 | Tucson, AZ | 37.90 | 124 | 99 |
| 118 | Little Rock, AR | 37.36 | 89 | 115 |
| 119 | Akron, OH | 37.35 | 114 | 104 |
| 120 | Houston, TX | 37.33 | 70 | 137 |
| 121 | Richmond, VA | 37.26 | 123 | 100 |
| 122 | Louisville, KY | 37.24 | 47 | 141 |
| 123 | Fort Lauderdale, FL | 36.97 | 71 | 124 |
| 124 | Newark, NJ | 36.83 | 86 | 123 |
| 125 | Oklahoma City, OK | 36.81 | 80 | 128 |
| 126 | Kansas City, MO | 36.52 | 111 | 114 |
| 127 | Anchorage, AK | 35.83 | 75 | 142 |
| 128 | Chicago, IL | 35.70 | 107 | 120 |
| 129 | Baton Rouge, LA | 35.30 | 85 | 132 |
| 130 | Wichita, KS | 35.21 | 150 | 40 |
| 131 | Aurora, IL | 34.68 | 109 | 126 |
| 132 | Brownsville, TX | 34.65 | 138 | 103 |
| 133 | Philadelphia, PA | 34.60 | 139 | 113 |
| 134 | Cincinnati, OH | 34.50 | 134 | 117 |
| 135 | Omaha, NE | 34.38 | 87 | 138 |
| 136 | Baltimore, MD | 33.72 | 144 | 108 |
| 137 | Providence, RI | 33.65 | 115 | 130 |
| 138 | Des Moines, IA | 33.59 | 142 | 105 |
| 139 | Greensboro, NC | 33.32 | 136 | 125 |
| 140 | San Antonio, TX | 32.93 | 76 | 148 |
| 141 | Toledo, OH | 32.31 | 130 | 134 |
| 142 | Cleveland, OH | 32.09 | 149 | 109 |
| 143 | Columbus, GA | 31.43 | 129 | 139 |
| 144 | Milwaukee, WI | 31.08 | 137 | 135 |
| 145 | Detroit, MI | 30.58 | 146 | 129 |
| 146 | New Orleans, LA | 29.52 | 141 | 140 |
| 147 | Springfield, MO | 28.91 | 148 | 136 |
| 148 | Fayetteville, NC | 28.85 | 101 | 147 |
| 149 | Shreveport, LA | 28.82 | 131 | 146 |
| 150 | Jackson, MS | 26.78 | 128 | 150 |
Job Opportunity & Competition – Total Points: 60
- Sales per Agent: Full Weight (~7.50 Points)
- Median Home Price: Full Weight (~7.50 Points)
Note: Real-estate agents are typically paid a commission based on the value of the home sold. - Annual Median Wage for Real-Estate Agents: Full Weight (~7.50 Points)
- Real-Estate Employment Attractiveness: Full Weight (~7.50 Points)
Note: This metric measures both real-estate job density (number of real-estate agents per working-age population) and competition (number of real-estate job openings per résumé). - Real-Estate Employment Growth (2013–2015): Full Weight (~7.50 Points)
- Annual Median Wage Growth for Real-Estate Jobs (2013–2015): Full Weight (~7.50 Points)
- Unemployment Rate: Full Weight (~7.50 Points)
- Projected Number of Real-Estate Jobs Needed by 2020 per Capita*: Full Weight (~7.50 Points)
Real-Estate Market Health – Total Points: 40
- Home Turnover Rate: Full Weight (~6.67 Points)
- Housing-Market Health Index: Full Weight (~6.67 Points)
- Days on Market: Full Weight (~6.67 Points)
- Average Ratio of Home Sale Price to Home List Price: Full Weight (~6.67 Points)
- Building-Permit Activity: Full Weight (~6.67 Points)
Note: This metric measures the number of unit permits pulled per capita. - Percentage of Home Flips: Full Weight (~6.67 Points)
Note: RealtyTrac defines a home flip as “a property that is sold in an arms-length sale for the second time within a 12-month period based on publicly recorded sales deed data.”
Sources: Data used to create this ranking were collected from the U.S. Census Bureau, Bureau of Labor Statistics, Zillow, Indeed, Projections Central – State Occupational Projections and ATTOM Data Solutions (RealtyTrac).